Generate the exercise results on the Gumbell distribution
Python source code: plot_gumbell_wind_speed_prediction.py
import numpy as np
from scipy.interpolate import UnivariateSpline
import pylab as pl
def gumbell_dist(arr):
return -np.log(-np.log(arr))
years_nb = 21
wspeeds = np.load('sprog-windspeeds.npy')
max_speeds = np.array([arr.max() for arr in np.array_split(wspeeds, years_nb)])
sorted_max_speeds = np.sort(max_speeds)
cprob = (np.arange(years_nb, dtype=np.float32) + 1)/(years_nb + 1)
gprob = gumbell_dist(cprob)
speed_spline = UnivariateSpline(gprob, sorted_max_speeds, k=1)
nprob = gumbell_dist(np.linspace(1e-3, 1-1e-3, 1e2))
fitted_max_speeds = speed_spline(nprob)
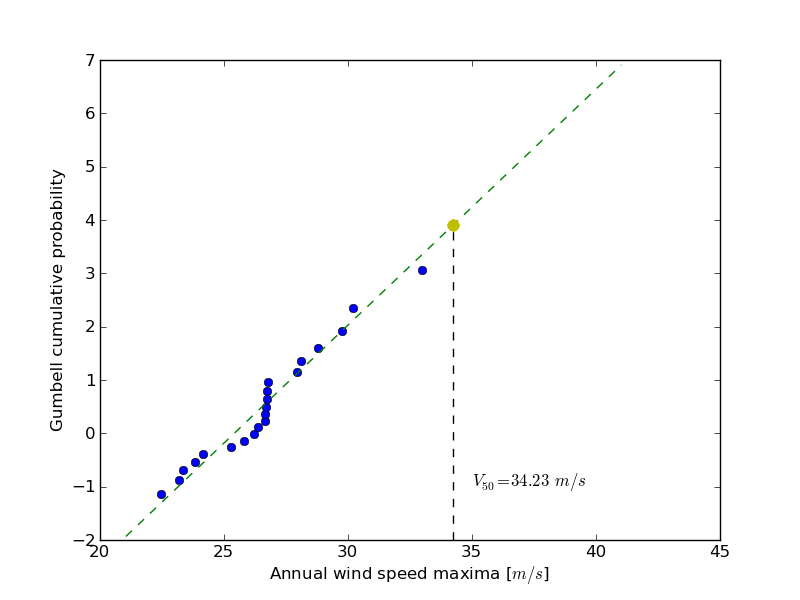
fifty_prob = gumbell_dist(49./50.)
fifty_wind = speed_spline(fifty_prob)
pl.figure()
pl.plot(sorted_max_speeds, gprob, 'o')
pl.plot(fitted_max_speeds, nprob, 'g--')
pl.plot([fifty_wind], [fifty_prob], 'o', ms=8., mfc='y', mec='y')
pl.plot([fifty_wind, fifty_wind], [pl.axis()[2], fifty_prob], 'k--')
pl.text(35, -1, r'$V_{50} = %.2f \, m/s$' % fifty_wind)
pl.xlabel('Annual wind speed maxima [$m/s$]')
pl.ylabel('Gumbell cumulative probability')
pl.show()
